 |
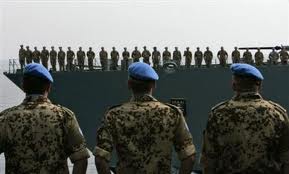
| Picture Credit: acus.org |
The Fifth Committee (Administrative and Budgetary) sets the Peacekeeping Budget each year from July to June. However, the committee reviews and adjusts the budget throughout the year. Since peace missions vary in number and duration, contributions to the Peacekeeping Budget fluctuate widely from year to year.
The Peacekeeping Budget pays for UN peacekeeping operations all over the world. The budget is financed through assessments of all UN member states, based on the scale of assessments for the Regular Budget. But the five permanent members of the Security Council, who approve all peacekeeping operations, pay a surcharge on top of their regular assessments. Poor countries get a discount on their rates. In the 1990s, as the Security Council launched an unprecedented number of peacekeeping operations, the Peacekeeping Budget and total debt to the budget rose quickly.
Note that peacekeeping operations debts are higher than debts to the UN regular budget. Furthermore, Non-payment of regular dues and peacekeeping assessments has made it impossible for the UN to pay countries that contribute troops and equipment. In some cases, rich non-payers prevent payment to poor troop contributors.
To view articles on UN Peacekeeping Finance, click here.
Debt of 15 Largest Payers to the Peacekeeping Budget
These tables present the monthly contributions to the UN peacekeeping operations budget by the fifteen largest contributors. UN peacekeeping operations debts are higher than debts to the UN regular budget.
UN Peacekeeping Operations Expenditures
This table and graph show UN Peacekeeping Operations expenditures since 1947.
UN Peacekeeping Operations Expenditures vs. Payment Arrears of Member States
This table and graph compare the peacekeeping operations expenditures with the total debt of all member states since 1975.
UN Peacekeeping Operations Expenditures in Current vs Real Terms:UN Peacekeeping Operations Expenditures in Current vs Real Terms
This table and graph compare the peacekeeping operations expenditures in current versus real terms, since 1950.
Payments Owed by the UN to Member Countries for Peacekeeping Operations (1996 - 2000 only)
Non-payment of regular dues and peacekeeping assessments has made it impossible for the UN to pay countries that contribute troops and equipment. In some cases, rich non-payers prevent payment to poor troop contributors. Data provided for:
ÂÂ
ÂÂ