News
By Roberto Bissio (1)
“Development” is usually understood as a synonym of “economic growth” and it is universally measured by per capita gross domestic product (GPD). “Sustainable” is usually understood as “within planetary boundaries” or “in harmony with Nature” or “respecting the rights of future generations and it is measured… well, the problem is that the world cannot agree on how to measure it and thus “sustainable development” is an unbalanced promise.
Target 8.4 of the Sustainable Development Goals (SDGs) commits to “decouple economic growth from environmental degradation” and SDG 12 promises to “ensure sustainable consumption and production patterns” and sets the target to “by 2030, achieve the sustainable management and efficient use of natural resources” (target 12.2).
The Global indicator framework for the SDGs defines the same two indicators for targets 8.4 and 12.2: material footprint and domestic material consumption. But the 50th meeting of the UN Statistical Commission ended in March with “material footprint” still ranked as a Tier III indicator, meaning that it lacks methodological agreement and can therefore not be used in the official international dataset and reporting.
But the “Global Resources Outlook 2019” just published by the UN Environmental Program has the numbers: “Global population has doubled and global economic activity (GDP) has grown fourfold since the 1970s”. In that period, annual global extraction of materials grew from 27.1 billion tons to 92.1 billion tons. The global average of material demand per capita grew from 7.4 tons in 1970 to 12.2 tons per capita in 2017.(2)
This is clearly not a sustainable trend and that is why Agenda 2030 promises “fundamental changes in the way that our societies produce and consume goods and services”.(3) The 2030 Agenda also reaffirmed (paragraph 12) the principle of “common but differentiated responsibilities” established by the Earth Summit in 1992. The differentiation in consumption is notorious: high-income countries consume every year 27 tons of materials per capita on average, which is 60 per cent higher than the upper-middle countries and more than thirteen times the level of the low-income group (at two tons per capita).(4)
This is why, while committing “all countries (to) take action” in order to “ensure sustainable consumption and production patterns”, the 2030 empasizes that this should happen “with developed countries taking the lead”.
“Decoupling” is the key concept here, if there is going to be continuous economic growth (deemed essential to eradicate poverty) avoiding environmental damage.
Domestic material consumption (DMC), is being used by the EU to claim that “since the year 2000 EU’s resource productivity has increased by about 40 %.”(5) (see Chart 1).
Resource productivity is the lead indicator of the ‘resource efficiency scoreboard’, developed in the context of the flagship initiative ‘A resource-efficient Europe’ under the Europe 2020 strategy.
Chart 1
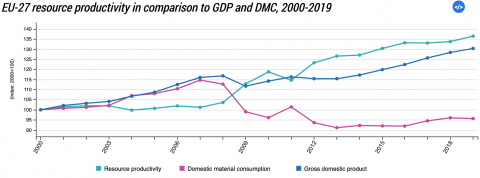
Resource productivity is the relation between GDP and DMC, which measures the weight of the yearly extraction of raw materials from the domestic territory, plus all physical imports minus all physical exports.
While a resource productivity increase is welcomed, the graphic also shows that actual material consumption has grown since 2012. And, in fact, the picture would be much worse if European trade was not, in practice, exporting to other countries the environmental degradation that SDG 8.4 wants to reduce globally.
Exporting the damages
In relation to their populations, the European Union and the United States trade and consume much more than China. With only 7 per cent of the world’s population, the EU-28 originated 15% of the world’s trade in goods in 2017. That year 3.7 trillion euros of merchandise crossed the EU-28 common borders (not counting intra-EU trade), a sum of exports and imports larger than that of the US, that had more imports but less exports and China, with more exports but less imports. Together, the three account for almost half of world trade in value.
Chart 2: World share of trade and population (percentages)
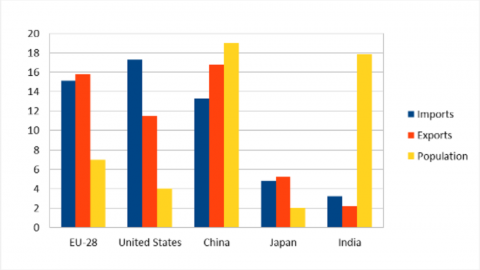
Value of merchandise trade and number of people as percentage of the world totals.
Source: WTO data (for trade) and UN data, processed by the author
In fact, as Eurostat itself explains DMC does not “provide an entirely consistent picture of global material footprints because they record imports and exports in the actual weight of the traded goods when they cross country borders instead of the weight of materials extracted to produce them.”(6) One imported cellphone adds 150 to 200 grams to the DMC of the buyer, but making it required extracting many kilos of ore in Bolivia to produce the lithium of the batteries and the burning of many kilos of coal and oil in South Korea to provide the energy required in its manufacturing.
By showing an increase in resource productivity, even when far from what would be required, DMC indicators provide a false comfort sensation. The need to change consumption patterns and innovate on production methods would be felt more urgent if material footprints were shown instead.
The material footprint, technically called “raw material equivalent” (RME) of the EU imports in 2016, according to the Eurostat estimates, were 2.5 times higher when expressed in RME than the imports recorded in the material flow accounts on which DMC is based (see Chart 3 below).
Chart 3
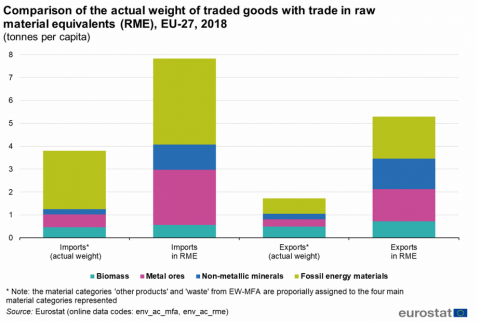
While European imports and exports are quite balanced in value (as seen in Chart 2), in terms of tons per capita, in 1917 the EU imported more then twice what it exported: 3.4 tons per capita entering the EU and 1.3 tons leaving it.
From a trading point of view, the EU appears as the big winner, as it imports (measured by weight) mainly raw materials (including half a ton per capita of fossil fuels) and semi-finished products and exports mainly finished products, of much higher value. Contrary to the ideas promoted by many populists, this trade transfers jobs and value into the EU and not out of it. (see Chart 4)
Chart 4
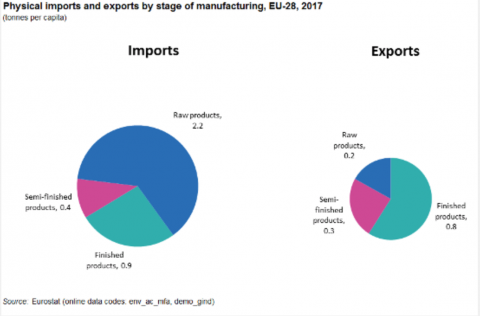
At the same time, those three and half tons of imports per capita require more than eight tons of material extraction somewhere else, The additional five tons per European are not accounted for in the DMC estimates and will therefore be attributed by the global statistics as if they had been consumed elsewhere.
This way of accounting hides a massive transfer of environmental damage out of Europe. The material flow accounts are available for each European country and for a variety of sub-sectors, but the material footprint indicators that would reveal those externalities are still being debated.
Eurostat explains that Chart 3 and the underlying data on raw material equivalents “are estimated for the aggregated EU economy by Eurostat with models that are still under development and therefore do not produce official statistics yet. The results have a higher statistical uncertainty.”(7)
What is not counted, doesn’t count and as the material footprint is absent from the SDGs’ global indicator framework and, therefore, from the official UN reporting, a key component of the sustainability agenda is missed and the environmental implications of trade as a tool for a massive transfer of environmental costs fall off the radar.
Notes:
1 This blog extracts data from a larger article on externalities in EU trade to be published in July by SDG Watch Europe.
2 UNEP, 2019, Global Resources Outlook, available at https://wedocs.unep.org/bitstream/handle/20.500.11822/27519/GRO_2019_IBL.pdf
3 Paragraph 28 of “Transforming our world: the 2030 Agenda for Sustainable Development” UN resolution A/RES/70/1, adopted September 2015, available at https://sustainabledevelopment.un.org/post2015/transformingourworld
4 Global Resources Outlook, Op. cit
5 https://ec.europa.eu/eurostat/statistics-explained/index.php/Resource_productivity_statistics
7 See “Material flow accounts statistics – material footprints”, available at https://ec.europa.eu/eurostat/statistics-explained/index.php?title=Material_flow_accounts_statistics_-_material_footprints